


The Value Of Seismic Shot Points In Confirming A Lease’s Sweet Spot
A promising shale lease can look compelling on a regional map, yet broad play boundaries rarely tell the full story. Productive acreage is usually concentrated within narrower geological trends shaped by thickness, pressure, thermal maturity, natural fractures, stress orientation, water content and well-spacing economics. Seismic shot points help connect those subsurface conditions with the actual location of a lease.
For companies, mineral-rights investors and land professionals, the value lies in combining seismic evidence with permits, wells, leases, pipelines and property records. A cluster of shot points does not guarantee commercial production, but it can reveal whether a parcel sits inside a carefully surveyed development corridor or near the uncertain edge of a play.
What Shot Points Reveal About Subsurface Conditions
A seismic shot point marks a location where controlled energy was introduced into the ground during an exploration survey. Sensors then recorded the returning waves, allowing geophysicists to build an image of underground layers and structures. Modern surveys may use vibroseis trucks, buried sources or other approved methods, while older records can contain less precise but still useful information.
The points themselves are not a direct measure of gas volume. Their importance comes from the survey pattern and the interpretation built from it. Closely spaced 3D coverage can help identify faults, folds, formation continuity and changes in depth. In contrast, widely separated 2D lines may provide regional context without resolving the geological variation across an individual lease.
For a lease review, the strongest evidence often comes from the relationship between shot points, interpreted seismic lines and producing wells. If a parcel lies within detailed coverage and the seismic interpretation supports consistent target depth and structure, the geological risk may be lower than for a similarly sized tract with no subsurface information.
Linking Seismic Coverage To A Lease Boundary
A sweet spot is usually a zone where several conditions align. The target formation may have suitable organic richness and maturity, sufficient thickness, favourable pressure and a completion design that can access hydrocarbons efficiently. Seismic data can help test whether those characteristics continue beneath a proposed lease or change sharply across its boundary.
Mapping requires careful attention to coordinate systems, survey dates and positional accuracy. A shot point shown near a property corner may have been recorded before a later subdivision, lease assignment or boundary adjustment. US public land and property records can also use different descriptions, including metes and bounds, sections, townships and ranges. A small location error can therefore create a misleading impression of geological coverage.
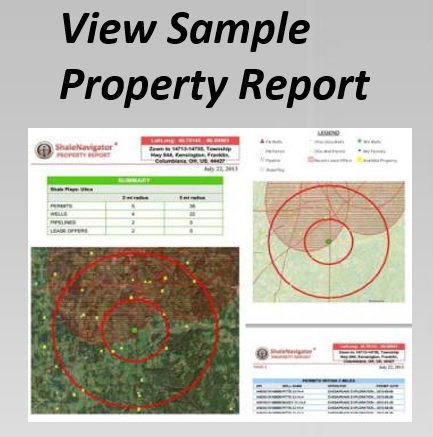
A practical workflow begins by plotting the lease polygon against seismic acquisition points, interpreted horizons, faults and nearby well laterals. The analyst can then compare target depth and structural continuity with drilling permits and completed wells. Shale Navigator users can strengthen this review by examining shale depth and permit density alongside the seismic picture, rather than treating any single layer as decisive.
Reading Shot-Point Density With Care
Dense shot-point coverage may indicate a detailed 3D survey, a complex geological target or a commercially important area. It may also reflect a survey designed for infrastructure, storage, carbon management or another purpose unrelated to the shale interval under review. Density is therefore a screening signal, not a standalone valuation metric.
The timing of acquisition matters as well. A survey completed before a major drilling campaign may reveal early operator interest. A later survey could be part of a broader development programme, field extension or technical reassessment. Comparing survey dates with leasing activity, permit applications, well results and pipeline construction can show whether seismic work translated into actual development decisions.
Sparse or absent points should not automatically be read as negative. Publicly available datasets may omit proprietary seismic, and different states or counties may publish records at different levels of detail. Confidentiality periods, incomplete digitisation and inconsistent metadata can make a well-covered area appear empty. A disciplined review records the source, vintage, survey type and confidence level for every seismic layer.
Combining Geological And Commercial Evidence
Seismic interpretation becomes more valuable when it is tested against operational facts. Nearby permits can show where companies have sought regulatory approval, while producing wells indicate whether the target interval has delivered commercial results. Pipeline access, gathering capacity, roads, water availability and established service networks affect whether a geological opportunity can become a viable development project.
Permit density deserves a nuanced reading. A concentration of applications may reflect strong operator confidence, but it can also result from acreage consolidation, expiries, compulsory spacing rules or a single company’s drilling schedule. Searching for individual permits is easier when the map is paired with the platform’s drilling permit search feature, allowing the reviewer to examine status, location and timing rather than relying on a visual cluster.
The same principle applies to mineral-rights availability. A lease inside a technically attractive zone may still face title defects, fragmented ownership, existing burdens, depth limitations or competing interests. Shot points help answer the geological question, while land and regulatory records determine whether the opportunity can actually be assembled and developed.
Applying The Method For Australian Users
Australian professionals often assess US shale opportunities from offices in Brisbane, Perth, Sydney or Melbourne, where local habits and regulatory expectations shape the workflow. Distances are commonly understood in kilometres, financial comparisons may be made in Australian dollars, and teams may work across time zones with Texas, Oklahoma or Pennsylvania. Converting units and recording the original US measurement prevents small assumptions from affecting a larger investment model.
Australian energy experience also provides useful context. Queensland’s coal seam gas industry has made land access, groundwater, gathering networks and community engagement familiar commercial considerations, even though shale development in the United States follows different geological and regulatory models. A reviewer who understands the role of infrastructure around towns such as Toowoomba or Roma can more readily appreciate why a US lease near processing or pipeline capacity may carry strategic value.
Legal comparisons require care. US mineral ownership and permitting are governed through federal, state and local frameworks, while Australia relies heavily on state and territory petroleum legislation, land access rules and environmental approvals. The Native Title Act 1993 may be relevant to Australian projects, but it does not replace title, permitting or land-access analysis for a US lease. Australian readers should treat it as a reminder that rights, consultation and access must be checked separately from geological potential.
Field conditions also influence how seismic information is interpreted. Bushfire risk, wet-season access in parts of Queensland and the Northern Territory, remote-road logistics and sparse regional services can affect Australian exploration schedules. In a US shale review, comparable practical constraints may include winter access, county roads, population density, water permits and surface-use agreements. The core lesson is familiar: a technically attractive subsurface target still depends on workable access and infrastructure.
To confirm a lease’s position within a likely sweet spot, begin with the survey footprint and shot-point quality. Add formation depth, thickness and maturity data, then compare faults, well performance, permits, lease status, mineral ownership and takeaway routes. Assign confidence grades to each layer and flag missing or proprietary information instead of filling gaps with assumptions.
Shale Navigator can support this process by bringing play boundaries, drilling permits, lease offers, available mineral rights, pipelines and property data into a single mapping environment. Start with the free seven-day account to test a target area, then use the broader subscription data where a deeper commercial review requires it. Review the evidence systematically, document the uncertainties and use the resulting map to focus technical, legal and investment diligence where it has the greatest value.