


How Shale Depth Shapes Permit Density Across U.S. Plays
Shale development is shaped by two related but distinct measurements: how far operators must drill to reach a productive formation and how concentrated drilling permits are across the surrounding acreage. Depth affects well cost, pressure management, casing design, and completion strategy. Permit density reflects operator activity, lease consolidation, infrastructure access, and the maturity of a play.
A shallow formation can be inexpensive to reach, yet generate relatively few permits if production is limited or land access is fragmented. A deeper reservoir may attract intense development when it offers strong economics, repeatable geology, and established pipeline capacity. Comparing these factors together gives investors, landowners, engineers, and mineral-rights professionals a more useful view than either metric alone.
The figures discussed here are broad planning ranges rather than fixed values. Shale formations vary significantly across a basin, and reported depth can mean true vertical depth, measured depth, or the depth to the top of a target interval. Permit counts also change as regulators approve new applications, operators consolidate acreage, and drilling programs move between counties.
Why Depth And Density Matter
Depth is a direct input into drilling economics. A deeper horizontal well generally requires a longer vertical section, more demanding pressure control, and additional casing or cementing work. The total measured depth can be far greater than the formation’s vertical depth because the lateral may extend several miles through the reservoir.
Permit density provides a different signal. A high concentration of permits may indicate an active development window, a large contiguous lease position, or a field moving rapidly from appraisal into manufacturing-style drilling. A low density can point to early-stage exploration, difficult surface access, limited infrastructure, weaker economics, or a play where development is spread across a very large area.
The most informative analysis compares permit density within a consistent geographic unit and time period. County-wide permit totals can obscure local differences, while a single month may exaggerate activity after a large operator files a batch of applications. Analysts should distinguish between permits issued, wells spudded, wells completed, and producing wells.
Regional Profiles Across Major Plays
The Permian Basin contains several stacked shale and tight-oil targets, including the Wolfcamp and Spraberry intervals. Target depths often range from roughly 6,000 to more than 12,000 feet, depending on the sub-basin and formation. Permit activity can be exceptionally dense in core counties because multiple benches are developed from the same surface position, although local rules and commodity prices create substantial variation.
The Haynesville is among the deeper major gas plays, commonly reaching approximately 10,000 to 14,000 feet or more. Its depth raises drilling and completion costs, but high deliverability and proximity to Gulf Coast markets have supported concentrated permit activity in parts of northern Louisiana and eastern Texas. The Marcellus is often shallower than the Haynesville, with many targets around 4,000 to 9,000 feet, but mountainous terrain, population density, and permitting restrictions can reduce surface-level permit concentration.
The Eagle Ford commonly falls within a broad 4,000-to-12,000-foot range, depending on location and target window. Its liquid-rich sections have historically drawn dense development in selected South Texas counties. The Bakken is generally deeper than many Appalachian targets, often around 8,000 to 11,000 feet, while the Niobrara and DJ Basin can show target depths from approximately 4,000 to 9,000 feet. These comparisons should be treated as regional benchmarks, not property-specific estimates.
A Practical Cross-Play Comparison
The table below presents approximate planning ranges and typical activity patterns. “Permit density” should be interpreted relative to the productive core and the same measurement period, rather than as a permanent ranking of every county in a play.
| Shale play or region | Approximate target depth | Typical permit-density pattern | Main interpretation |
|---|---|---|---|
| Marcellus, Appalachia | 4,000–9,000 ft | Moderate to high in core areas, uneven across counties | Strong gas potential, but surface and regulatory constraints matter |
| Haynesville | 10,000–14,000+ ft | High in concentrated development corridors | Deep drilling is supported by high-rate gas wells and infrastructure |
| Permian Wolfcamp | 6,000–12,000+ ft | Very high in core oil counties, variable elsewhere | Stacked targets can increase activity from the same surface acreage |
| Eagle Ford | 4,000–12,000 ft | High in established liquid-rich zones | Depth and fluid mix strongly influence commercial intensity |
| Bakken | 8,000–11,000 ft | Moderate to high in core North Dakota acreage | Deep horizontal wells depend on oil prices and takeaway capacity |
| Niobrara, DJ Basin | 4,000–9,000 ft | Concentrated and locally high | Development is shaped by urban proximity, spacing, and local regulation |
Permit density should never be read as a simple proxy for reservoir quality. A dense cluster may reflect a major operator’s scheduled drilling campaign rather than superior geology. Conversely, sparse permits may occur over valuable minerals when companies are waiting for better prices, negotiating surface access, or evaluating a deeper stacked target.
Geological And Commercial Drivers
Formation depth interacts with pressure, temperature, rock strength, and fluid composition. Deeper reservoirs may have stronger natural pressure and higher gas content, but they can require more specialized equipment and larger completion budgets. Shallower formations can reduce drilling cost, yet they may have lower pressure or thinner pay zones that demand more precise landing and stimulation.
Permit density is also affected by acreage ownership and well spacing. When one operator controls a large, contiguous block, permits may appear in a tight cluster. Split mineral ownership, unleased tracts, environmental setbacks, and compulsory pooling rules can spread activity out even where the underlying geology is attractive.
Infrastructure is another decisive factor. A deep gas play with nearby processing and pipeline capacity can support more permits than a shallower oil play facing transportation bottlenecks. Road access, water supply, gathering systems, export routes, and compressor availability all influence whether approved permits become drilled wells.
Reading Permit Patterns On A Map
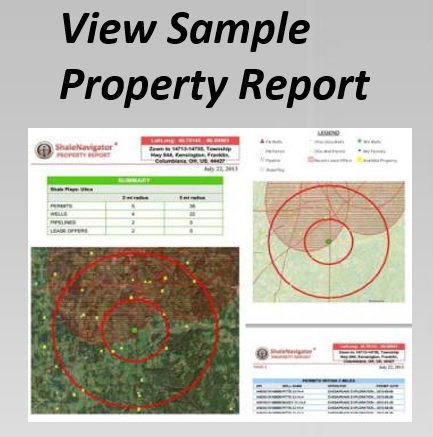
Mapping permits alongside formation outlines helps reveal whether activity is concentrated in a proven core or scattered across a broader exploratory area. Users can compare permit locations with wells, lease offers, available mineral rights, property boundaries, and pipeline corridors. The well activity map is particularly useful for separating newly permitted locations from older producing wells and inactive or canceled projects.
A useful workflow begins by filtering permits by date, operator, county, and status. Next, compare the permit cluster with well orientation and lateral length. A dense group of north-south permits may reflect one spacing unit design, while a wider pattern can indicate multiple benches or separate development phases. Looking at nearby completion dates can show whether density represents sustained activity or a short-lived filing surge.
Depth data should be attached to the specific well or target interval whenever possible. Basin averages are useful for screening, but they cannot substitute for a lease-level review. A property near the edge of a play may have a materially different target depth, pressure regime, or completion outlook than a tract only a few miles away.
Making The Comparison Investment Ready
For mineral-rights investors and landowners, permit density can indicate potential leasing interest, but it does not guarantee a near-term offer. The quality of the surrounding activity matters more than the raw number of permits. Recent permits by financially active operators, nearby completed wells, and access to gathering infrastructure generally provide stronger evidence than a high count of old or expired applications.
Engineers and landmen can use depth-density comparisons to prioritize diligence. Deeper, highly concentrated plays may require closer review of drilling costs, pad design, water handling, and pressure-control requirements. Shallower areas with scattered permits may call for a different investigation focused on title, surface restrictions, urban setbacks, and whether the target interval is commercially proven.
The Shale Navigator data store can support a broader review by helping users evaluate available datasets and combine location-based information with property or mineral-rights research. Bringing several layers together reduces the risk of judging a tract from permit activity alone.
Recommended Screening Practices
A disciplined comparison should use the same definitions and geographic scale across every play. The following practices help turn broad basin observations into a more reliable screening process:
- Compare permits per square mile or per defined development unit, not just total permits.
- Separate active, expired, canceled, and issued permits before calculating density.
- Pair permit locations with well depth, completion dates, production status, and lateral direction.
- Check pipelines, roads, processing facilities, and water infrastructure near the active core.
- Review mineral ownership, lease status, spacing rules, and surface restrictions before estimating development potential.
Depth and permit density work best as complementary indicators. Depth frames the likely technical and capital burden, while density shows where companies have chosen to commit resources under current geological, regulatory, and market conditions. Neither metric is sufficient by itself, but together they can highlight mature cores, emerging corridors, and areas that deserve closer due diligence.
Use Shale Navigator to compare plays on an interactive map, investigate permits and wells, and connect development activity with property and mineral-rights data. A free seven-day account provides a practical starting point for testing the platform before applying its expanded datasets and subscription features to a specific basin or tract.