


What Well Log Data Density Reveals About Shale Formation Confidence
When operators talk about "good rock," what they really mean is data confidence. Well log density measurements sit at the heart of that confidence, telling geologists and engineers whether a shale target is thick enough, organic enough, and consistent enough to warrant a multi-million-dollar drilling program. Density curves built from gamma, resistivity, sonic, and porosity logs reveal the physical character of the formation in ways that surface geology alone simply cannot match.
For Australian operators working unconventional plays like the Beetaloo Sub-basin in the Northern Territory, well log density has become the deciding factor in committing to appraisal campaigns. The same data points that unlock permits in the Utica are now being applied down under, where acreage is vast and the cost of a dry hole is punishingly high.
Reading the Gamma-Density Curve for Organic Richness
Gamma-ray logs measure natural radioactivity in shale, which tends to be high in clay and organic matter. Density logs, run with a radioactive source and detectors, measure electron density by analysing how gamma photons scatter back to the tool. When these two curves are plotted against depth, the resulting signature provides a quick visual of where organic-rich intervals sit and how thick they are.
A high gamma reading paired with a low bulk density reading — typically below 2.5 grams per cubic centimetre — usually points to kerogen-rich rock. Operators chasing liquids-rich windows pay close attention to density spikes that indicate carbonate or quartz stringers, which can fracture differently during stimulation. In Australian plays like the Cooper Basin's Roseneath and Epsilon formations, early appraisal wells leaned heavily on this curve pairing to identify "sweet spots" before pad development began.
The density log also helps separate mineral matter from pore fluid. Hydrocarbons, especially gas, lower the measured bulk density compared to water-filled rock. That contrast is what allows petrophysicists to calculate total organic carbon indirectly, an essential input for any modern shale resource estimate.
Why Spacing Matters Across a Lease Block
A single density log tells you about one location. To understand a formation across an entire lease block, you need multiple logs spaced at predictable intervals. The denser the well log coverage, the more confident your regional model becomes, because each new datapoint reduces the uncertainty between known points.
In Queensland's Surat Basin, where coal seam gas development has proceeded for two decades, operators built their geological models on the back of thousands of wells. That high density of data turned what was once speculative acreage into a predictable producing region. Density logs from those early wells guided every subsequent decision about where to drill development pilot holes and where to design gathering systems.
By contrast, frontier regions like the Canning Basin in Western Australia remain sparsely logged. Where only a handful of vertical pilot holes exist, subsurface confidence is thin, and operators must either acquire more seismic and core data or accept greater drilling risk. The contrast between data-rich and data-poor basins is one of the clearest illustrations of why log density translates directly into risk-weighted capital decisions.
Working With Sparse Data in Remote Terrain
Australian shale exploration faces a uniquely local challenge: vast distances between wells, harsh summer heat across the inland basins, and a regulatory environment that varies sharply between states and territories. Drilling a single vertical pilot hole in the Beetaloo can cost many millions and require fly-in crews, fuel convoys, and pastoralist co-ordination. Every additional well log in such a setting is expensive but disproportionately valuable.
Because of these costs, Australian operators often lean heavily on analogue data from North American plays. Reading a regional review like the Utica shale insights report can save a junior explorer from reinventing the wheel when planning their own appraisal programme. By comparing formation thickness, depth, and thermal maturity against a known analogue, teams can decide whether the gamble is worth the next round of drilling capital.
Field crews operating in the outback have their own lingo for these decisions. A "duster" well means the same thing in Roma as it does in Oklahoma — a well that came up dry — and a "cracker" still refers to a strong, sustained producer. When the team heads back to camp after a long arvo on the lease, the question on everyone's lips is whether the new log will firm up the next drilling location or send the geologist back to the drawing board.
From Logs to Permits and Pipeline Siting
Well log density does not live in isolation. Once a team has high confidence in the formation, that confidence flows into permit applications, lease valuations, and even pipeline routing decisions. Regulators reviewing an exploration permit want to see the underlying data density that justifies the proposed work programme, and a tightly spaced log suite makes that justification far easier.
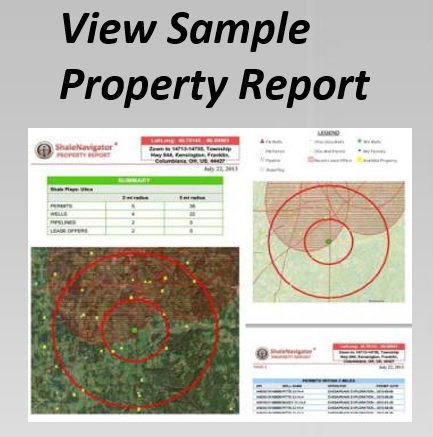
For landowners and mineral-rights holders, the practical value of well log density is simple: more data means a clearer picture of what sits beneath their property, which strengthens negotiations with operators. Even a single offset well log within several kilometres can dramatically change the offer price for a lease, because it reduces the exploration risk the buyer would otherwise carry. For investors, browsing the permit database on Shale Navigator gives a quick way to compare data density across plays and counties without needing a specialist on speed dial.
Pipeline developers also lean on log density to optimise gathering systems. Tight-spacing fields require denser midstream infrastructure, so higher well counts along a corridor justify larger-diameter trunk lines. Where log coverage is thin, even a confirmed discovery may sit for years waiting for sufficient adjacent activity to make a tie-in economic.
Putting the Data to Work With Modern Tools
Modern mapping platforms have transformed how this information is consumed. Instead of plotting cross-sections on paper, geologists now layer well log attributes over base maps, lease boundaries, and pipeline networks. The ability to filter by formation, density range, or vintage of the log lets users triage thousands of records in minutes.
Anyone wanting to see how dense the available data is across a particular play can load the Shale Navigator wells layer, then zoom into a county or basin to see exactly which operators hold permits, what vintage the logs are, and where the gaps remain. That kind of visual triage is particularly valuable for an Australian consultant trying to benchmark the Beetaloo against the Marcellus, or a Surat Basin landman comparing offset log quality before negotiating with Santos or Origin Energy.
The takeaway is straightforward. Well log density is a leading indicator of subsurface confidence, and that confidence cascades from exploration budgets all the way through to midstream construction. Whether the team is reviewing permits in Brisbane, planning a pilot well near Tennant Creek, or modelling a coal seam gas development west of Dalby, the same principle holds: the more logs you have, the better your decisions will be. Get in touch with Shale Navigator today to map the data density of your next play.