


What Ambient Noise Data Reveals About Active Drilling Sites
A drilling site has a sound profile that changes with its equipment, operating schedule, terrain, and stage of development. Pumps, engines, generators, compressors, trucks, and construction crews each contribute distinct acoustic patterns. When those patterns are recorded over time, ambient noise data can provide clues about activity that may be difficult to observe from a single visit or satellite image.
Sound monitoring does not replace regulatory records, permit research, or direct field inspection. It adds a time-sensitive layer to those sources. A quiet site may be inactive, temporarily paused, operating during daytime hours, or shielded by terrain. A persistent low-frequency signal may indicate machinery running beyond visible work areas.
For companies, mineral-rights investors, landowners, engineers, and public agencies, this information can support a broader understanding of drilling intensity and nearby development. The strongest results come from combining acoustic observations with location-based data about wells, permits, pipelines, leases, and property ownership.
What Acoustic Monitoring Captures
Ambient noise monitoring measures sound in the surrounding environment rather than recording a single machine in isolation. A sensor can track sound pressure levels, frequency ranges, duration, and changes by hour or day. Repeated measurements help distinguish a brief passing truck from a continuous industrial source.
The most useful records often include baseline readings taken before drilling begins. That baseline establishes the natural soundscape, which may include wind, insects, livestock, road traffic, rail activity, or nearby commercial operations. Analysts can then compare later readings against normal conditions instead of treating every elevated reading as evidence of drilling.
Microphone placement matters. A sensor near a public road may capture traffic more strongly than site equipment, while a device behind a berm may understate the apparent volume of the operation. Weather, vegetation, ground cover, and building materials can also affect how sound travels. Consistent placement and documented conditions are essential for meaningful comparisons.
How Drilling Activity Appears In Sound
Different phases of shale development tend to create different acoustic signatures. Site preparation may produce intermittent heavy equipment, grading, haul trucks, and earthmoving activity. Drilling often generates a steadier mechanical presence from engines, pumps, and support systems, although the intensity can vary as crews change tasks.
Hydraulic fracturing may create a more concentrated pattern of high energy activity. Multiple pumps, sand handling systems, water transfer equipment, and trucks can raise both overall sound levels and low-frequency energy. The work may occur in stages, producing clear periods of increased activity followed by quieter intervals.
Production sites usually have a different profile. Pumping units, separators, compressors, and associated facilities can create persistent tones or humming sounds. A compressor may produce a narrow, recognizable frequency band, while vehicle movements create short peaks. Repeated daily patterns can suggest a stable operating routine, whereas irregular bursts may indicate maintenance, well servicing, or construction.
Time-of-day analysis adds important detail. A site with daytime peaks and quiet nights may follow a conventional work schedule. Activity that continues through the night could reflect a particular operational phase, equipment that runs continuously, or noise from another nearby facility. Sound data identifies patterns; it does not establish the cause without supporting evidence.
Signals Need Geographic Context
An acoustic reading becomes more useful when connected to the correct parcel, well pad, road, pipeline, or facility. Sound spreads across boundaries, and a sensor may capture several sources at once. Mapping helps analysts identify whether an observed signal is plausibly associated with an active drilling site or with a highway, processing plant, compressor station, or neighboring pad.
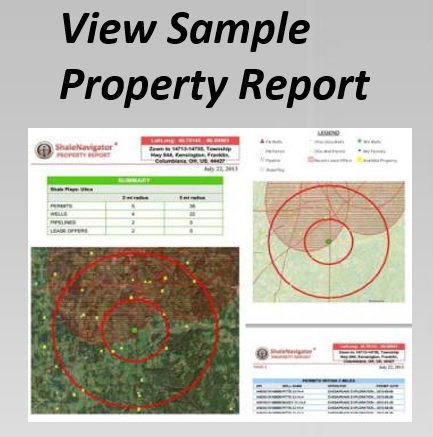
Shale Navigator can help place those observations within a wider development picture. Researchers reviewing available property data can compare sound-related concerns with mineral availability, ownership information, and nearby parcels. Permit and lease layers may reveal whether a location is moving toward drilling, while pipeline data can indicate the infrastructure supporting production.
| Acoustic Pattern | Possible Site Activity | Supporting Evidence To Check |
|---|---|---|
| Sustained mechanical hum | Drilling, compression, or production equipment | Well status, facility location, operating permits |
| Repeated heavy-vehicle peaks | Hauling, construction, water, or sand transport | Road access, pad expansion, truck routes |
| High low-frequency energy | Fracturing pumps, engines, or compressors | Completion schedules, nearby facilities |
| Daytime-only bursts | Shift-based construction or field work | Work schedules, inspection records, weather |
| Continuous sound with limited variation | Production or permanently installed equipment | Producing wells, pipeline connections, compressor maps |
Distance and topography should be considered alongside the map. A pad in a valley may transmit sound farther than expected in certain conditions, while ridges and engineered barriers may reduce exposure in other directions. Mapping supplies the spatial framework needed to interpret measurements responsibly.
What Analysts Can Infer
Ambient sound can help identify whether a site appears active, intermittently active, or relatively quiet during a monitoring period. This can be valuable when public records lag behind field conditions or when a permit covers several stages of work. A rising noise trend may coincide with mobilization, pad construction, or the arrival of completion equipment.
The data can also support comparisons between sites. Two pads may have similar permit histories but different operating profiles. One may show repeated truck movements and sustained machinery, while another remains quiet for weeks. Those differences can direct further research into well status, contractor activity, infrastructure readiness, or changes in development timing.
For landowners, acoustic evidence may help document recurring disturbance, overnight activity, or changes from an established baseline. For attorneys and public agencies, a carefully maintained record can support discussions about nuisance claims, permit compliance, environmental review, or community impact. The value is strongest when recordings include timestamps, sensor locations, weather notes, calibration information, and a clear chain of custody.
Investors can use sound trends as an early screening signal rather than a definitive valuation measure. Increasing activity near a lease may suggest development momentum, but it does not prove commercial production or guarantee future infrastructure. Financial and legal decisions should still rely on title work, regulatory filings, engineering analysis, and verified production data.
Limits Of Ambient Noise Evidence
Noise alone cannot reliably identify a specific operation when several industrial sources are nearby. A compressor station may sound similar to equipment on a drilling pad, and a busy road can overwhelm the acoustic signature of a smaller site. Wind and rain can also create elevated readings that have nothing to do with development.
Short monitoring periods may produce misleading results. Crews can pause for weather, maintenance, supply delays, or safety reasons. A quiet weekend does not establish that a site is inactive, just as one unusually loud day does not prove continuous operations. Longer observation windows make it easier to recognize recurring patterns and anomalies.
Technical quality matters as much as duration. Sensors should be calibrated, protected from tampering, and configured with appropriate sampling intervals. Analysts should preserve original files and distinguish measured sound levels from interpreted events. Where possible, recordings should be compared with site visits, public notices, permit records, aerial imagery, and local observations.
Privacy and legal requirements also deserve attention. Monitoring should focus on environmental conditions and industrial sources, not private conversations. Recording practices may be governed by state law, property access rules, or project-specific agreements. A defensible program defines its purpose, limits collection, and documents how information is stored and used.
Building A Practical Monitoring Workflow
A useful workflow begins with a geographic question. The objective might be to determine whether a permitted pad is active, investigate a change in neighborhood noise, compare development near competing mineral positions, or document conditions before a lease decision. Defining the question prevents the project from collecting large amounts of sound data without a clear interpretation method.
Next, identify likely sources and reference points. Mark well pads, access roads, pipelines, processing facilities, residences, and other industrial operations. A map-based platform can help organize those relationships, while subscription-based research tools may provide expanded data for users conducting repeated due diligence. Shale Navigator outlines its subscription options for users who need broader access to development and property information.
A simple monitoring program can follow these practices:
- Record baseline conditions before visible site activity begins.
- Use consistent sensor locations, heights, settings, and time intervals.
- Log weather, traffic, construction observations, and unusual local events.
- Compare daily and weekly patterns instead of relying on isolated readings.
- Verify acoustic interpretations against permits, maps, field observations, and well records.
The final step is to present findings with appropriate confidence. Terms such as “consistent with,” “likely associated with,” and “not attributable from available data” are often more defensible than absolute claims. Clear uncertainty does not weaken a report; it shows that the analysis separates measured conditions from assumptions.
Sound evidence becomes especially valuable when it is integrated into a broader land and energy research process. A map may show where development is authorized, property data may show who could be affected, and acoustic records may indicate when activity is actually occurring. Together, these sources produce a more practical view of shale operations than any single dataset can provide.
For assistance evaluating relevant mapping, reporting, or property information, contact the Shale Navigator team. Begin with a focused monitoring question, connect your recordings to mapped development layers, and use the resulting evidence to support informed decisions about active drilling areas.