


Finding shale wells within half mile of an elementary school
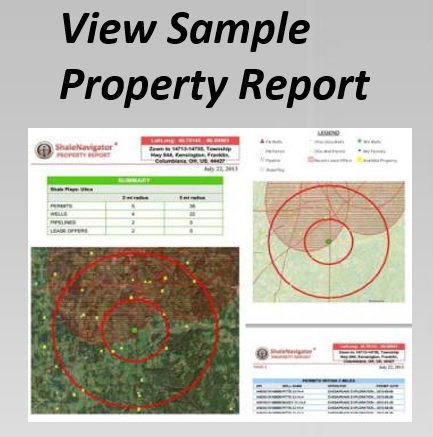
Using Shale Navigator’s interactive map to identify shale wells within a half mile of an elementary school turns a vague concern into a documented spatial question. Begin with the school property, place an approximately 805-metre radius around it, and ask which mapped wells, permits and related infrastructure fall inside that buffer. The exercise supports land review, community research and due diligence, but it is a screening tool rather than a verdict on safety, contamination or legal compliance.
Shale Navigator is built around United States shale development, so its datasets should be labelled as United States evidence when used by Australian readers. Australian projects use different geological terms, regulators and distance conventions. Still, the map supports a sound transferable habit: compare location, status and ownership before drawing conclusions from proximity alone.
For an Australian primary school review, the half-mile radius should be converted to metres and paired with state and local records. That combination lets users test a United States example or organise local research without confusing a map symbol with an operating well, a drilling right or a confirmed impact.
Why a half-mile screen matters
Start by defining what “within half a mile” means. A radius measured from the school boundary is normally more useful than one measured from a postal address or the centre of a large school campus. The mapped school parcel should also be checked because adjoining land, roads and easements can shift the edge of the buffer by tens of metres.
Then separate the evidence into categories. A producing or completed shale well is an actual well location. A drilling permit shows regulatory authorisation for a proposed or planned well, while a lease offer records a proposed transaction. A pipeline, mineral-rights holding or surface-property interest may affect the setting without proving that drilling will occur nearby.
The approximately 805-metre distance is best treated as a first-pass exposure screen. Traffic, truck movements, noise, vibration, air emissions and emergency response may depend on road routes, terrain, operating hours and mitigation measures. A well just beyond the radius could still matter, and several wells within it may operate under different conditions. The map identifies where to investigate, not what will happen.
Setting the school-centred search area
For a United States example, use the school as the spatial anchor and the map’s property information to confirm the parcel, address and surrounding features. Create an 800-metre buffer equivalent to the half-mile screen, then review the shale-play and well locations against it. Keep straight-line and travel-distance results distinct: the first answers the stated question, while the second may better describe local access and community exposure.
Enable the layers needed for a complete review rather than judging from play boundaries alone. Shale plays describe geological areas, not individual wells. Drilled wells provide point locations, drilling permits add planned activity, and lease offers or mineral-rights records reveal where companies and landowners are negotiating or retaining subsurface interests.
Confirm the school’s parcel, radius method and unusual map features before exporting or sharing results. If the location cannot be matched confidently, contact Shale Navigator with the address and map reference. The service can clarify coverage and data limitations, although it cannot verify Australian records.
Reading the map layers correctly
Read each symbol with its date, status and source in view. A permitted well may never be drilled, an old lease offer may have expired, and an operating well may have changed equipment, production or ownership. Preserve the layer used, the observation date and the underlying record identifier so another reviewer can reproduce the screen.
Property and mineral-rights layers help explain who may benefit from or respond to development. Surface ownership does not always control subsurface rights in the United States, and a company’s interest in a lease does not establish that it holds every nearby permit. A useful permit-price analysis also shows why permit activity deserves careful comparison with nearby land prices instead of being treated as proof of a boom.
Pipelines deserve a separate check because they can be older than nearby shale activity or cross areas with no wells. Their presence may influence land access, construction effects and future development corridors. Compare pipeline status with the school buffer, but do not infer routine shale-truck traffic from a pipeline alignment alone.
A repeatable screening checklist
A disciplined workflow reduces false conclusions and creates a record that can be shared with decision-makers. The map should be the first layer of inquiry, followed by authoritative registries and local knowledge.
Layers and spatial checks
- Mark the school parcel and a clearly labelled 805-metre buffer before adding energy layers.
- Check completed, operating and permitted well symbols separately, including their record dates.
- Overlay drilling permits, lease offers and mineral-rights interests without treating them as well locations.
- Trace pipelines and roads to distinguish direct proximity from likely access routes.
- Save screenshots and exports showing layer names, dates and the selected radius.
The second stage tests whether the map signal is current, complete and legally meaningful. It also converts a broad concern into specific questions for agencies, landowners and operators.
Records and follow-up checks
- Compare map results with state or territory drilling, licence and environmental registers.
- Verify the school parcel against council or cadastral records and note nearby road crossings.
- Check native-title or access agreements where they may affect approval or land access.
- Search for current operating conditions, monitoring data and documented community complaints.
- Record uncertainty, conflicting dates and missing records beside every mapped feature.
For Australian users, this follow-up is essential because agency and council map layers may lag behind field activity. A dated application, a licence variation and an operating approval can all appear differently across sources. Report the map finding, the corroborating record and the unresolved gap as three separate statements.
Turning the map into informed local action
Australian readers should recognise familiar realities while changing the underlying assumptions. In Sydney, Melbourne, Brisbane and Perth, families navigate left-hand traffic and signed school zones that commonly apply 40 km/h limits during arrival and departure periods. A truck route that looks close on a radial map may be separated from the school gate by a railway, arterial road or restricted-traffic street.
The local energy market is also different from the United States model. Australia’s eastern gas market is strongly influenced by LNG export projects, while coal seam gas remains important in New South Wales and Queensland; commercial-scale shale drilling is not established at United States levels. Any Australian comparison should therefore focus on transferable mapping methods, not imply that the same plays or drilling patterns exist locally.
Regulatory checks should cover council planning schemes, state or territory environmental approvals and resources licences, and the Commonwealth Environment Protection and Biodiversity Conservation Act when a project involves matters of national environmental significance. Native Title Act requirements, Indigenous Land Use Agreements and local access agreements may also shape the process. These regimes do not create an automatic 805-metre school exclusion zone, so the chosen radius must be labelled as an analytical screen rather than a legal threshold.
For a practical demonstration, readers can start a trial to access the free seven-day account and inspect the available layers before deciding whether a subscription fits their project. Build the school-centred buffer, compare well and permit evidence, attach the local verification records, and present the result as a traceable decision brief. That sequence gives councils, investors, land professionals and community groups a common factual starting point without overstating what a map can prove.