


The Evolution of Drilling Permits in the Marcellus Since 2020
Drilling permits provide one of the clearest near-term signals of activity in the Marcellus Shale, but they require careful interpretation. A permit reflects an operator’s authorization to pursue a well under a state regulatory framework; it does not guarantee that the well will be drilled, completed, or placed into production. Permit counts therefore sit between corporate planning and physical development.
Since 2020, Marcellus permitting has moved through several distinct phases. The COVID-19 downturn interrupted field activity, the natural gas price recovery encouraged renewed planning, and later shifts in commodity prices, takeaway capacity, inflation, and investor priorities produced a more selective pattern. Pennsylvania remains the central permitting market, while West Virginia and eastern Ohio add important cross-border context.
For landowners, mineral-rights investors, landmen, attorneys, and energy analysts, the useful question is not simply whether permit totals rose or fell. The stronger analysis examines where permits were issued, which operators received them, whether permits converted into drilled wells, and how the surrounding infrastructure and property market changed at the same time.
The Shock Of 2020
The first phase of the period was shaped by the pandemic, a collapse in energy demand, and an abrupt reduction in drilling budgets. Operators responded by protecting cash flow, reducing rig activity, and deferring projects that were technically permitted but not essential to near-term production. Permit applications and approvals consequently reflected a cautious capital environment.
Marcellus development did not stop. Existing pad construction, gathering commitments, lease obligations, and strategic acreage positions kept some projects moving. Yet the pace became less predictable, and a permit issued in 2020 often represented a longer-term inventory decision rather than an immediate drilling schedule.
State-level totals also require context. Pennsylvania, West Virginia, and Ohio use different reporting systems, terminology, and approval procedures. A comparison based only on annual permit counts can obscure differences in permit type, horizontal well design, amendments, expirations, and the timing between authorization and spud.
Recovery And Selective Growth
As gas markets improved in 2021 and 2022, permitting activity generally strengthened from the pandemic lows. Operators returned to pad development where pipeline access, gathering capacity, and well economics supported additional investment. The rebound was especially visible in established producing counties with existing infrastructure and a concentration of contiguous leasehold.
The recovery was selective rather than uniform. Companies prioritized longer laterals, multiwell pads, and locations with favorable geology and lower expected development costs. A larger permit package could therefore indicate a focused development campaign instead of a broad return to the drilling intensity seen during earlier shale expansions.
Natural gas prices also influenced the timing of approvals. When prices improved, operators had greater flexibility to sanction new wells. When prices weakened, they often retained high-quality permits while delaying spuds or completion work. This distinction makes the relationship between permits and production more complex than a simple year-over-year comparison.
What The Permit Data Reveals
A reliable review should separate permits issued, permits drilled, wells completed, and producing wells. These categories answer different questions. Issued permits indicate regulatory approval and potential activity; drilled wells show field execution; completed wells demonstrate a later investment decision; producing wells reveal the development’s operational outcome.
Permit status is equally important. Active, expired, canceled, transferred, and amended records can point to different operator strategies. A cluster of amendments may indicate pad redesign or a change in well orientation, while repeated expirations may suggest weaker economics, delayed infrastructure, or a shift in acreage priorities.
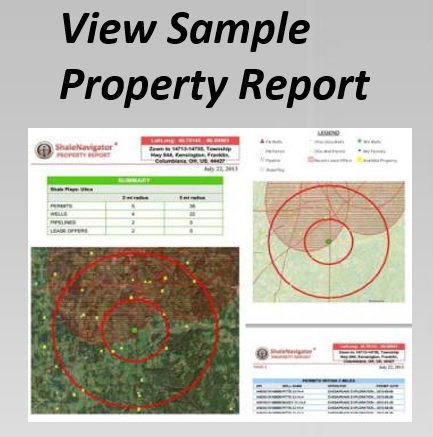
Researchers can combine state records with mapping layers and property information through the data store. That approach helps users connect permit locations with shale-play boundaries, pipelines, lease offers, mineral-rights availability, and ownership information instead of treating a permit as an isolated point on a map.
| Period | Broad permitting pattern | Main drivers | Best interpretation |
|---|---|---|---|
| 2020 | Disruption and deferral | Pandemic demand shock, low prices, budget reductions | Permits often reflected retained options rather than immediate drilling |
| 2021–2022 | Recovery and concentrated growth | Stronger gas markets, infrastructure access, renewed capital spending | Operators favored core acreage and multiwell development |
| 2023 | More uneven activity | Price volatility, inflation, service costs, takeaway constraints | Permit totals became more sensitive to basin-specific economics |
| 2024 onward | Selective, infrastructure-led planning | Capital discipline, producer efficiency, market uncertainty | High-quality locations and existing systems received priority |
Geography Matters More Than The Headline Total
The Marcellus is not a single uniform development area. In Pennsylvania, counties such as Washington, Greene, Susquehanna, Bradford, Lycoming, and Tioga have different combinations of geology, gathering systems, population density, permitting history, and operator presence. Permit activity can rise in one corridor while slowing significantly in another.
West Virginia’s northern and north-central development areas also connect to the broader Marcellus supply chain, particularly where gathering and processing networks cross state lines. Ohio’s eastern Utica and Marcellus activity adds another layer, since operators may compare targets and allocate rigs across formations rather than treat each play independently.
Mapping the distance between permits and pipelines can reveal why certain locations remain active. A permit near an operating gathering line may advance faster than one requiring new infrastructure. Conversely, a remote permit can still matter if it secures a strategic position or supports a future pad program.
Permits, Leasing, And Mineral Rights
Permit trends influence how market participants evaluate acreage, but they do not determine mineral value by themselves. A property near recent permits may benefit from operator attention, yet value also depends on lease terms, depth reservations, production history, unit configuration, road access, and the probability of development.
For landowners, permit activity can provide a useful signal when reviewing lease proposals or monitoring existing agreements. It may help identify whether development is expanding toward a property, remaining concentrated elsewhere, or slowing after an earlier wave of leasing. However, a permit should never be treated as a promise of a well on a particular tract.
Available mineral rights and property listings can be reviewed alongside permit locations using available property data. Combining these layers helps distinguish speculative interest from properties situated within active development corridors, while also giving investors a clearer view of competing acreage and nearby infrastructure.
Economics Behind The Shifts
The economics of a Marcellus well changed during the period even when the underlying geology did not. Drilling and completion costs rose with labor, steel, equipment, and fuel expenses. At the same time, operators became more efficient through longer laterals, improved completions, pad designs, and better subsurface targeting.
Pipeline takeaway remains a central constraint. The Marcellus is a prolific gas-producing region, but access to markets can determine whether incremental production earns attractive returns. Capacity expansions, compressor projects, processing availability, and regional basis differentials can all influence whether a company seeks permits in a particular county.
Lease economics also affect the timing of permits. Bonus payments, acreage size, royalty terms, and development clauses shape the cost and flexibility of assembling a drilling unit. The relationship between lease bonus payments and acreage size offers useful context for evaluating why some operators consolidate large blocks before permitting while others proceed with smaller, targeted positions.
A Practical Framework For Analysis
Permit data is most valuable when reviewed as a time series rather than as a single annual count. Analysts should track the issue date, operator, well type, county, permit status, proposed depth, pad relationship, and later drilling outcome. Comparing the same fields across multiple years reduces the risk of confusing reporting changes with genuine market movement.
A useful workflow also connects permits to production and infrastructure. If permitting rises while drilling and completions remain flat, the increase may represent inventory building. If permits, spuds, and completions move together, the activity is more likely to reflect an active development cycle. If permits decline near a pipeline-constrained area but rise in a better-connected corridor, infrastructure may be shaping the result.
The following practices help turn permit records into a more dependable market view:
- Separate new permits from amendments, transfers, renewals, and expired approvals.
- Compare permit locations with gathering lines, processing facilities, and major pipelines.
- Track operators and pad-level programs instead of relying only on statewide totals.
- Measure the time between permit issuance, drilling, completion, and production.
- Review lease, mineral-rights, and property data before drawing investment conclusions.
What Comes Next For The Marcellus
The next phase of Marcellus permitting is likely to remain disciplined and concentrated. Mature operators have extensive inventories, but they are under pressure to balance production targets with shareholder returns, emissions expectations, infrastructure constraints, and volatile gas prices. That environment favors locations that can be developed efficiently within existing systems.
Permit totals may therefore remain lower than during the basin’s rapid expansion without signaling that the play has lost all relevance. A smaller number of permits can support substantial production when wells are longer, pads are denser, and completion designs are more productive. Conversely, a temporary increase in approvals may not translate into immediate output if companies are preserving optionality.
For anyone monitoring the basin, the strongest signal is the alignment of several indicators: permits, spuds, completions, production, operator activity, pipeline access, and mineral-rights transactions. Explore those relationships with Shale Navigator’s mapping and reporting tools, then use the available data to evaluate Marcellus opportunities with location-specific evidence rather than permit counts alone.