


How Takeaway Capacity Shapes Haynesville Drilling Rates
Haynesville drilling economics are closely tied to the ability to move gas from northern Louisiana and East Texas to premium markets. When gathering systems, processing plants, interstate pipelines, and LNG export routes have room, operators can monetize production more reliably. When those systems are full, even highly productive wells may face weaker realized prices and slower development schedules.
This connection makes takeaway capacity a central variable in the pace of Haynesville activity. Rig counts and drilling permits respond to commodity prices, service costs, acreage commitments, and corporate strategy, but transportation constraints can amplify or offset each of those factors. A strong gas market does not automatically produce more drilling if new molecules cannot reach buyers.
For mineral owners, landmen, investors, and energy professionals, tracking infrastructure alongside permits offers a clearer view of future development. Mapping pipeline routes, processing assets, lease positions, and drilling activity can reveal where capacity is supporting growth and where bottlenecks may be forming.
Why Gas Transportation Matters To Operators
A shale well generates value only when its production can be gathered, processed, and delivered to a market. Gathering lines connect individual well pads to processing facilities, while larger transmission pipelines carry residue gas toward power plants, industrial users, storage fields, or LNG terminals. Each stage can limit the volume that reaches the next one.
When capacity is scarce, producers may receive lower prices at the wellhead because local supply exceeds nearby demand. Basis differentials can widen between the Henry Hub benchmark and regional trading points. A company may also encounter firm transportation charges, reservation fees, temporary curtailments, or restrictions on connecting new wells.
These pressures influence drilling rates in several ways. Operators can reduce rig deployments, defer completions, leave wells uncompleted, or prioritize pads with existing pipeline access. Some may continue drilling under contractual commitments while postponing hydraulic fracturing and sales. As a result, permit filings, spudded wells, completed wells, and producing wells can move at different speeds.
Haynesville Exposure To Regional Bottlenecks
The Haynesville has a high production profile, short cycle times, and strong exposure to LNG-linked demand along the Gulf Coast. Those features support rapid development when prices and takeaway conditions are favorable. They also make infrastructure timing especially important because a concentrated wave of high-volume wells can fill local systems quickly.
Pipeline expansions and new processing capacity can unlock drilling inventories that were previously constrained. An operator with dedicated takeaway may accelerate permits and pad construction ahead of a competitor that depends on interruptible transportation. Conversely, a project delay can cause companies to redirect capital to areas with better market access, even when the underlying Haynesville rock remains attractive.
The effect is rarely uniform across the play. Northern Louisiana, DeSoto Parish, Sabine Parish, and East Texas acreage can have different access to gathering networks, processing plants, and major transmission corridors. Lease obligations and well spacing also affect timing. A county with fewer permits may reflect infrastructure limitations, while another may show strong activity because a new connection has improved economics.
| Takeaway Condition | Likely Operator Response | Typical Effect On Drilling |
|---|---|---|
| Ample gathering and processing capacity | Add rigs, accelerate completions, pursue pad development | Higher permit and rig activity |
| Firm transportation with favorable pricing | Protect production schedule and maintain capital plans | Stable or rising drilling rates |
| Tight local pipeline capacity | Defer wells, seek alternative routes, negotiate new contracts | Slower permits or delayed completions |
| Major pipeline expansion under construction | Prepare pads and secure acreage ahead of service | Short-term planning, later activity increase |
| Weak gas prices with available capacity | Reduce capital spending despite transportation access | Lower drilling from commodity pressure |
| Curtailed or interrupted takeaway | Shut in production or delay sales connections | Fewer completions and lower near-term activity |
Reading Permits As An Infrastructure Signal
Drilling permits provide an early indication of operator intent, but they should not be treated as a direct measure of immediate production growth. Companies may obtain permits well before mobilizing a rig, particularly when they are securing regulatory approvals, preserving lease rights, or organizing multiwell pad development.
A sustained rise in permits near a new or expanded pipeline can signal that producers expect better market access. The pattern becomes more meaningful when permits are followed by increased spud counts, completion activity, and pipeline connection work. A surge in permits without corresponding infrastructure progress may indicate a backlog rather than imminent output.
Comparing regional trends can also help separate basin-wide gas economics from local transportation effects. For example, a Marcellus permit comparison illustrates how year-over-year permit analysis can reveal changes in development momentum. Similar comparisons in Haynesville counties can show whether activity is broadening, concentrating around infrastructure, or weakening across the play.
The Timing Gap Between Capacity And Drilling
Takeaway projects often require years of planning, permitting, construction, and commissioning. Drilling decisions may respond before a pipeline is operational. Operators with access to reliable project schedules can build pads, order equipment, and secure services in advance. This creates a timing gap in which permit activity rises before production capacity actually improves.
The reverse can happen when a pipeline expansion is delayed. A producer may have permits, contracted rigs, and drilled wells ready to complete, yet lack a practical route for sales gas. This can create a growing inventory of drilled but uncompleted wells. The company may preserve cash by slowing completions until transportation becomes available or market prices improve.
Infrastructure also changes the competitive position of acreage. A property near a gathering connection may command more interest than a similar tract requiring costly lateral construction. Mineral-rights investors and landowners should therefore examine pipeline proximity, right-of-way availability, and processing access rather than relying on geological quality alone.
Weather, Maintenance, And Short-Term Volatility
Takeaway constraints are not always permanent. Extreme temperatures, flooding, freezing conditions, compressor outages, and scheduled maintenance can temporarily reduce transport availability. In the Haynesville, severe storms may disrupt roads, pad operations, electric service, gathering systems, or downstream demand. These interruptions can produce short-lived changes in drilling and completion schedules.
Weather can also distort permit and rig data. A decline during a difficult operating period may reflect access problems or delayed field work rather than a lasting reduction in operator confidence. The relationship between weather and permits is explored in broader basin activity through seasonal drilling effects, a useful reminder that timing patterns can complicate comparisons.
Maintenance events and outages can have similar effects. A temporary constraint may cause producers to shift crews to another pad, delay a completion, or sell gas under less favorable terms. Analysts should compare monthly figures with longer rolling averages and review operational announcements before interpreting a single-month decline as a structural trend.
Practical Signals To Monitor
A useful Haynesville takeaway analysis combines infrastructure data with permitting, production, and market indicators. The most informative signals include:
- New pipeline capacity, compressor stations, processing plants, and expansion milestones near active acreage
- County-level permit trends compared with spud, completion, and producing-well counts
- Regional basis differentials, local gas prices, LNG demand, and storage conditions
- The number of drilled but uncompleted wells and changes in completion timing
- Operator guidance on firm transportation, capital budgets, gathering agreements, and expected rig activity
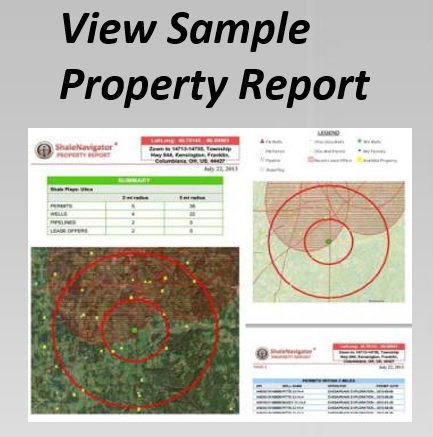
Interactive mapping makes these relationships easier to examine spatially. Users can layer shale play boundaries, permits, pipelines, lease offers, mineral rights, and property information to identify whether new activity follows infrastructure corridors. The Shale Navigator team supports users working across energy research, mineral ownership, land management, and property analysis.
For investors and landowners, the strongest opportunity may arise before a capacity expansion is fully reflected in production statistics. Early permit growth, right-of-way activity, gathering construction, and operator announcements can provide clues about where development is likely to accelerate. However, those signals should be tested against project schedules, gas prices, and the availability of actual downstream market access.
Takeaway capacity does not determine Haynesville drilling rates by itself, but it sets the practical ceiling for growth. When transportation is available, high-quality acreage can move quickly from permit to production. When systems are constrained, operators become more selective, and the value of timing, infrastructure position, and contractual access increases.
Use Shale Navigator to examine Haynesville permits, pipeline networks, acreage, and property data in the same geographic context. A free seven-day account can help you evaluate infrastructure-linked activity and build a more informed view of where drilling momentum may develop next.