


Mapping the Western Gulf Basin for the Next Shale Gas Frontier
The Western Gulf Basin is becoming an increasingly important focus for shale gas exploration, infrastructure planning, mineral-rights investment, and energy-market analysis. Stretching across parts of Texas and Louisiana, this broad petroleum province contains several productive formations, established pipeline networks, active industrial corridors, and large areas where subsurface potential still requires careful evaluation.
Unlike a single, clearly defined shale play, the basin is a collection of overlapping geological systems and commercial opportunities. The Haynesville and Bossier formations dominate the Louisiana and East Texas gas conversation, while the Eagle Ford, Austin Chalk, and other South Texas targets contribute liquids-rich and gas-oriented development potential. Mapping these areas together helps users see how geology, ownership, permitting, transportation, and market access interact.
A reliable digital map can turn a large regional question into a property-level investigation. Operators can compare drilling activity with lease positions, landowners can examine nearby development, and mineral-rights buyers can screen opportunities before committing substantial time or capital.
Defining the western Gulf opportunity
The Western Gulf Basin is shaped by its position along the Gulf Coast sedimentary system. Thick layers of Cretaceous and Jurassic rock, mature source formations, structural variations, and long histories of oil and gas production make the region geologically complex. That complexity creates both advantages and risks: proven infrastructure is widely available, but productive intervals can vary significantly over short distances.
Northern portions of the region are closely associated with dry-gas development in the Haynesville and Bossier shales. Farther west and south, the Eagle Ford and Austin Chalk provide a mixture of natural gas, condensate, and crude oil opportunities. A regional map must therefore distinguish between formations rather than treating the basin as a uniform shale gas field.
This distinction matters for capital allocation. A prospect near high-pressure gas infrastructure may have a different value profile from a similar-looking tract that lacks takeaway capacity. Likewise, a location with strong production nearby may still face permitting, title, pooling, water, environmental, or surface-access constraints.
Why spatial context matters
Subsurface data provides only part of the decision framework. A formation may have attractive thickness and pressure, yet its commercial outlook depends on lateral length, completion design, gathering access, regional pricing, and the ability to secure contiguous acreage. Spatial analysis brings these variables into a common view.
Interactive mapping also helps users identify patterns that are difficult to see in spreadsheets. Clusters of drilling permits may reveal a developing fairway. A concentration of lease offers can signal competitive interest. Existing pipelines can show where transportation is available, while gaps in infrastructure may point to both constraints and potential midstream investment.
For landowners and mineral-rights investors, parcel boundaries are especially important. A tract may sit inside a promising shale trend but have fragmented ownership, limited access, or an unclear mineral estate. Reviewing property data alongside play boundaries and nearby wells creates a more realistic picture of opportunity than relying on regional production statistics alone.
Connecting geology, permits, and property data
The most useful basin map combines several layers rather than displaying formation boundaries by themselves. Shale play outlines establish geological context, while permits and wells indicate where companies are committing resources. Lease offers can show areas of commercial interest before drilling becomes visible.
Property and mineral-rights information adds another level of detail. Users can compare available tracts with nearby development, pipeline corridors, county boundaries, and existing leases. For teams searching for acquisition targets, available properties can serve as a starting point for narrowing a broad basin search into specific opportunities.
Data quality and timing remain essential. Permits may be issued before a well is drilled, leases can change status, and production records may lag current field activity. A mapping workflow should therefore use multiple indicators and preserve the date associated with each dataset. Historical layers can be valuable when assessing how a play expanded, contracted, or shifted toward different counties.
Regional signals worth tracking
Several signals can help distinguish an emerging shale gas corridor from a mature or slowing area. Sustained permitting activity, repeated well development, infrastructure expansion, and lease consolidation are among the strongest indicators. Individually, each signal can be misleading; together, they provide a more useful market picture.
The relationship between production and transportation is especially important in the Western Gulf Basin. Haynesville development, for example, has been closely tied to high-volume gas takeaway and demand from power generation, liquefied natural gas exports, industrial facilities, and Gulf Coast processing. In South Texas, gas economics are also influenced by associated production from oil-focused operations and regional pipeline constraints.
| Mapping layer | What it reveals | Practical use |
|---|---|---|
| Shale play boundaries | Formation extent and geological setting | Screen prospects by target interval |
| Drilling permits and wells | Current operator activity and development direction | Track momentum and nearby competition |
| Lease offers | Areas of active mineral-rights interest | Identify potential acquisition zones |
| Pipelines and gathering systems | Transportation access and possible bottlenecks | Evaluate takeaway and midstream exposure |
| Available mineral rights | Tracts that may be open for review or purchase | Build an acquisition shortlist |
| Property and ownership data | Parcel structure, access, and surface context | Support land, title, and outreach research |
These layers can also support scenario analysis. An investor might compare a high-activity area with strong pipeline access against a less-developed location where acreage is more affordable. An engineering team could examine whether planned wells align with existing gathering routes. A landowner could monitor nearby permits and infrastructure changes that may affect negotiations or surface use.
Commercial and operational considerations
Shale gas development in the Western Gulf Basin involves more than locating a productive rock interval. Operators must evaluate spacing, pressure, water sourcing, disposal capacity, road access, compression, gathering agreements, and the condition of existing infrastructure. Environmental and regulatory requirements can differ across counties and states, adding another reason to maintain accurate geographic records.
Landmen and attorneys benefit from a map that brings lease and parcel research into the same workflow as geological information. It can help identify overlapping interests, nearby activity, and potential conflicts before fieldwork begins. Realtors and landowners can use similar information to understand how energy development may influence property conversations, access arrangements, or future land use.
Government agencies and university researchers may use basin mapping for regional planning, infrastructure studies, economic analysis, or public education. A shared visual reference can make technical findings easier to communicate, especially when several counties, operators, or geological formations are involved.
No map replaces title verification, engineering review, or legal advice. It does, however, make those processes more efficient by helping professionals focus on the locations and questions most likely to matter.
Building a practical basin-screening workflow
A consistent workflow starts with a regional view and gradually moves toward property-level detail. First, users can identify the relevant shale plays and compare their geographic footprints. Next, they can overlay permits, wells, and pipelines to determine where activity and infrastructure are concentrated.
The following steps help keep the analysis focused:
- Compare multiple shale formations instead of assuming one basin-wide trend.
- Review recent permits alongside historical drilling to identify sustained activity.
- Check pipeline, gathering, and processing access before estimating development potential.
- Examine mineral-rights availability, parcel boundaries, and ownership context together.
- Record the date and source of each layer before making investment or operational decisions.
A useful screening process should also separate facts from assumptions. A nearby pipeline does not guarantee capacity, and a lease offer does not guarantee a completed transaction. Similarly, strong production in an adjacent county may not translate directly to the target tract. Mapping is most powerful when it organizes evidence and highlights where additional diligence is required.
Turning regional insight into action
The Western Gulf Basin offers a rare combination of mature energy infrastructure, multiple shale targets, active operators, and continuing demand for natural gas. Its opportunity set is broad, but that breadth makes disciplined geographic analysis essential. A prospect should be judged by its geology, access, ownership, permitting environment, and connection to markets.
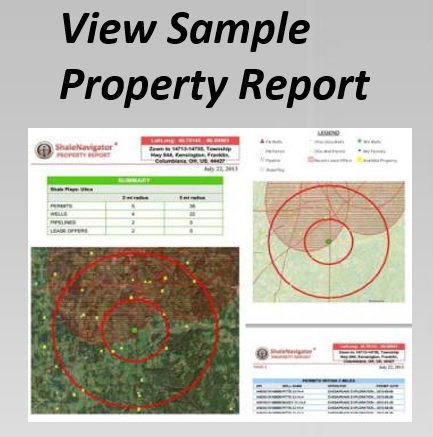
Shale Navigator brings these considerations into an interactive mapping and reporting environment designed for energy professionals, investors, landowners, and researchers. Users can begin with a free seven-day account, explore regional layers, and evaluate how play boundaries, permits, lease activity, pipelines, mineral rights, and property information fit together. Teams that need assistance applying the data to a specific basin or project can contact the Shale Navigator team.
Start by examining the Western Gulf Basin at regional scale, then narrow the view to the counties, formations, and tracts that match your objectives. A clearer map can reveal where shale gas potential is supported by real-world access, activity, and ownership conditions—and where deeper diligence should begin.