


Mapping the Spraberry Trend’s Intersection with Wolfcamp Permits
The Spraberry Trend and Wolfcamp formation occupy a large portion of the Midland Basin in West Texas, where stacked pay zones have transformed drilling economics and land management. Their geographic overlap is significant, but it is not uniform. Operators may hold permits targeting different benches, while surface acreage, mineral ownership, infrastructure, and regulatory boundaries create additional layers of complexity.
A map that simply shades the entire Spraberry or Wolfcamp area cannot show how development is actually progressing. The more useful approach connects geologic extents with active permits, lease activity, pipelines, property records, and available mineral rights. This makes it easier to distinguish broad play boundaries from specific opportunities and operational constraints.
For companies, investors, landowners, and analysts, the intersection of these datasets offers a practical view of the Midland Basin. It can reveal where Wolfcamp permitting is concentrated inside or near the established Spraberry footprint, where development is expanding, and where apparently open acreage may require closer title or regulatory review.
Geographic Frame Of The Midland Basin
The Spraberry Trend is an extensive hydrocarbon-producing region in the Midland Basin, generally associated with multiple low-permeability sandstone and siltstone intervals. Its development history predates the modern shale boom, but horizontal drilling and hydraulic fracturing have renewed interest in parts of the trend and improved access to stacked reservoirs.
The Wolfcamp is a deeper and geologically diverse interval that underlies or overlaps portions of the Spraberry area. It is commonly divided into benches or subintervals, and operators may pursue different targets depending on depth, pressure, rock quality, spacing, and nearby well performance. As a result, a surface location within the Spraberry Trend does not automatically indicate a single Wolfcamp development pattern.
County boundaries and field designations add another layer to the map. Much of the relevant activity is concentrated across counties such as Midland, Martin, Glasscock, Reagan, Upton, and neighboring areas, although exact play boundaries vary by source. A reliable analysis should preserve those differences rather than treating a regional outline as a precise lease or drilling boundary.
Why The Intersection Matters
Mapping Wolfcamp permits against the Spraberry footprint helps identify stacked-play development. When permits cluster in areas associated with both formations, operators may be evaluating multiple benches from the same surface position or leasehold. That can influence spacing, unitization, future drilling inventory, and the potential value of mineral interests.
The overlap also helps explain why permit density may vary within a seemingly continuous trend. A company may have acreage in the broader Spraberry region but prioritize Wolfcamp drilling in a smaller area because of reservoir quality, existing infrastructure, service availability, or economics. Permit patterns therefore provide clues about development focus, although they do not prove commercial success.
For mineral-rights investors and landowners, the intersection can support more disciplined screening. An acreage position near permits targeting a relevant Wolfcamp bench may deserve attention, but its value depends on ownership, lease terms, depth severances, held-by-production provisions, pooling, and competing claims. Geographic proximity is a starting point rather than a final valuation.
Reading Permit Layers Correctly
A permit map should be interpreted as a record of authorized or proposed activity, not as a production map. Depending on the source and update cycle, a permit may represent a recently approved well, an amendment, a re-entry, a sidetrack, or a project that has not yet reached completion. Status fields, issue dates, operator names, API numbers, well names, and target formations are essential for separating current activity from older records.
Target formation fields can be especially useful when examining the Spraberry-Wolfcamp relationship. A permit labeled for a Wolfcamp interval may sit within a broader Spraberry trend polygon, while another nearby permit may target a Spraberry bench, an adjacent formation, or a different completion objective. Filtering by formation and permit status helps prevent the visual overlap from being mistaken for identical drilling intent.
Surface and bottom-hole locations should also be reviewed separately. Horizontal wells can extend across lease lines, county boundaries, or broad areas that are far from the surface pad. A map showing only surface points may understate the acreage affected by a permitted lateral, while a map using only bottom-hole points can obscure access, pad construction, and infrastructure requirements.
Combining Land, Infrastructure, And Ownership Data
The most useful analysis adds lease offers, pipelines, property boundaries, and mineral-rights information to the formation and permit layers. Pipelines can help explain where drilling activity is practical, but proximity alone does not establish takeaway capacity, connection rights, or available processing access. Existing roads, gathering systems, water infrastructure, and field facilities may be equally important.
Property data provides a bridge between subsurface activity and real-world ownership. An investor reviewing available mineral rights can compare prospective acreage with nearby permits, operator positions, and infrastructure rather than evaluating a listing in isolation. This type of overlay can highlight parcels surrounded by development as well as tracts that appear promising but lack a clear operational pathway.
Lease offers and mineral availability should be treated as separate signals. A lease offer may indicate an attempt to secure control, while available mineral rights may reflect an owner’s willingness to sell or a marketed interest. Neither necessarily confirms a current lease, drilling commitment, or clear title. County records, title opinions, recorded assignments, and lease documents remain necessary for transaction-level decisions.
| Map Element | What It Shows | Best Use | Important Limitation |
|---|---|---|---|
| Spraberry extent | Broad regional play footprint | Establishing geographic context | Boundaries vary by source and may be generalized |
| Wolfcamp permits | Proposed or authorized well activity | Locating current development focus | A permit does not guarantee completion or production |
| Surface locations | Pad and access positions | Reviewing roads, facilities, and surface impacts | May not show the full horizontal reach |
| Bottom-hole locations | Approximate lateral endpoints | Studying subsurface direction and acreage coverage | Can hide surface access and pad constraints |
| Pipelines and facilities | Existing or nearby infrastructure | Assessing gathering and takeaway context | Proximity does not confirm capacity or connection |
| Property and mineral data | Ownership and marketed interests | Screening acquisition or leasing opportunities | Title, depth rights, and encumbrances require verification |
A Practical Mapping Workflow
Begin with a consistent geographic frame. Select the counties or basin area under review, then display the Spraberry and Wolfcamp boundaries as reference layers. Because public and commercial sources may define formations differently, record the source, date, and terminology used for each layer.
Next, filter permits by operator, status, issue date, well type, and target formation. Look for clusters rather than isolated points. A group of Wolfcamp permits inside the Spraberry footprint may indicate a focused drilling program, while a line of permits extending beyond the established trend may signal acreage testing or a boundary area requiring further research.
After locating permit clusters, add lateral paths, property parcels, lease activity, and pipelines. Examine whether the same owners, operators, or mineral interests recur across adjacent tracts. Compare historic permits with newer filings to identify sustained development, pauses, or changes in target formation.
Finally, validate important findings with regulatory records and county documentation. A map is highly effective for discovery and spatial comparison, but it should not replace legal due diligence, engineering review, title examination, or direct confirmation of well status.
Signals That Deserve Closer Review
Permit density is one useful indicator, but the pattern matters more than the raw count. Repeated filings by the same operator may suggest a development program, while permits spread across several operators may reflect broader area competition. In either case, the dates and status codes should be examined to distinguish active momentum from a historical backlog.
Spacing and orientation can reveal how operators are approaching stacked reservoirs. Parallel laterals may indicate development of a common bench, while different orientations or surface corridors may reflect lease geometry, faulting, terrain, or infrastructure constraints. These visual patterns are clues, not definitive interpretations of reservoir quality.
Areas where permits, mineral availability, and pipelines overlap may attract attention from landmen and investors. Yet apparent concentration can be misleading if mineral rights are severed by depth, subject to existing leases, held by production, or burdened by royalty and overriding interests. A parcel may be geographically attractive while offering little immediately actionable control.
Recommendations For Map-Based Review
A disciplined review keeps the map analytical rather than merely visual. Use the following practices when evaluating Wolfcamp activity across the Spraberry region:
- Record the source and update date for every formation, permit, property, and infrastructure layer.
- Separate active, expired, amended, canceled, and completed permits before comparing development intensity.
- Compare surface locations with lateral paths, unit boundaries, and county records.
- Investigate depth rights, lease terms, pooling, royalties, and title exceptions for any promising acreage.
- Treat permit clusters as research signals and verify them with regulatory, engineering, and legal evidence.
The strongest results come from repeating the analysis over time. A single map captures a moment, while successive permit filings, completions, assignments, and property changes reveal the direction of development. Saving dated views or export records can help analysts measure expansion and identify areas where activity is accelerating or fading.
For professional users, consistent naming and filtering are equally important. Formation names, operator names, county abbreviations, and permit statuses may vary across records. Standardizing those fields before comparison reduces false patterns and makes internal reports easier to audit.
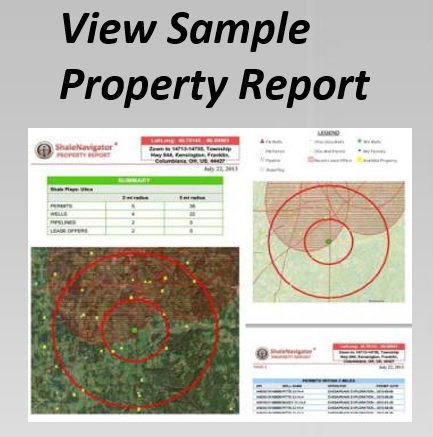
A clear view of the Spraberry-Wolfcamp overlap can support better prospect screening, ownership research, and development planning. Use Shale Navigator to examine the relevant map layers and reporting tools, then contact the Shale Navigator team for access details that fit your research needs. Start with the free seven-day account and build a documented view of permits, minerals, property, and infrastructure across the Midland Basin.