


Comparing Gross And Net Acres On A Prospective Tract
A promising shale tract can look large on a map while representing a much smaller economic position. The difference usually comes down to gross acres versus net acres: gross acreage describes the full area under consideration, whereas net acreage reflects the portion attributable to a particular owner, lease position, or working interest.
For Australian investors, landmen and technical teams reviewing US opportunities, this distinction is essential. Acreage is often discussed in acres rather than hectares, title structures differ from Australian petroleum tenements, and several parties may hold overlapping rights across the same mapped area. A visual comparison should therefore be supported by ownership, lease, permit and production information.
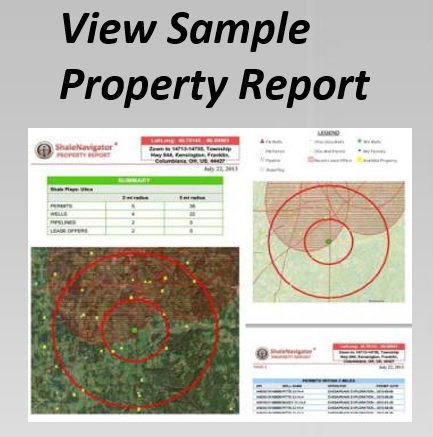
Shale Navigator provides an interactive way to examine prospective US shale positions alongside relevant property and development data. Used carefully, its map can help you identify the tract boundary, measure its apparent scale, and investigate whether the commercial interest is broad, divided or already committed.
Define The Acreage Terms Before Mapping
Gross acres are the total surface or subsurface area covered by a tract, lease, unit or prospect. If a lease covers 640 acres, its gross acreage is 640 acres even if three owners share the mineral rights or several companies participate in development. Gross acreage is useful for understanding the footprint of a project, but it does not tell you how much of that position belongs to one company.
Net acres are calculated by applying an ownership or participation percentage to the gross area. A company holding a 50% mineral interest in a 640-acre lease has 320 net mineral acres. If it has a 25% working interest in a 640-acre drilling unit, the net working-acre position may be 160 acres before considering royalties, burdens or other contractual adjustments.
The phrase “net acres” can mean different things in marketing material. It may refer to net mineral acres, net leasehold acres, net royalty acres or net revenue interest. Record the precise definition used in each source, because comparing one operator’s net mineral acres with another’s net revenue position can produce a misleading result.
Set The Map To The Correct Area
Begin by locating the relevant shale play, county, basin or prospect area. Shale Navigator’s map layers can help narrow the search to a practical geography, such as a development corridor near existing infrastructure or a cluster of permits. Do not assume the entire displayed shale play is equally prospective; geology, spacing rules, depth, pressure and access can vary substantially within a single play.
Switch on property, tract, lease, mineral-rights and permit layers where available. Zoom in until individual parcels and boundaries can be distinguished, then identify whether the prospective tract follows surveyed property lines, a lease outline, a drilling unit or a broader internal prospect boundary. A tract shown as one shape may contain multiple legal descriptions or ownership blocks.
For Australian users accustomed to tenement maps, the visual comparison may feel familiar, but US shale rights can be fragmented by county records, historic conveyances and private leasing. A broad outline is a starting point rather than proof of a single continuous title. Treat each boundary as a prompt to verify the underlying legal and commercial records.
Measure Gross Acreage From The Tract Boundary
Use the map’s measurement or parcel information to estimate the full area enclosed by the prospective tract. Save the result as gross acres and note the measurement date, data source and boundary used. If the platform shows a lease or prospect outline, compare it with the underlying parcels rather than relying on a single displayed number.
A useful check is to compare the mapped gross area with the stated acreage in a lease offer, broker package, permit application or county record. Differences can arise from rounded figures, overlapping leases, excluded roadways, irregular surveys or changes to a drilling unit. A 640-acre description, for example, may be represented by several smaller parcels that do not form a perfect square.
Australia’s metric system also makes unit discipline important. Convert acres to hectares only after recording the original figure; one acre is approximately 0.4047 hectares. This prevents a Queensland or Perth-based investment team from accidentally comparing a US gross-acre figure with a gross-hectare figure without adjustment.
Identify The Rights Behind The Acreage
Once the gross footprint is established, inspect who controls the relevant rights. A property owner may hold surface rights while minerals are owned by another party. A lease may give an operator the right to explore and produce, but the operator may share working interest with partners and pay royalties to mineral owners.
Look for lease offers, available mineral rights, ownership indicators and related property records. Mark parcels that are leased, unleased, expired, under option or subject to competing claims. Where several leases overlap, separate the gross area of each lease from the company’s net position. Do not add overlapping gross acres together unless the rights are genuinely distinct and the analysis permits that treatment.
This is comparable to separating a petroleum tenement’s overall area from the interest held by a joint venture participant in Australia. A company may report the full area of a permit while holding only a percentage interest. The same principle applies to US shale acreage, even though the terminology and public-record systems differ.
Calculate Net Acres With A Consistent Method
For each mapped block, write down the gross acreage and the applicable interest percentage. The basic calculation is gross acres multiplied by the relevant ownership or participation percentage. A 320-acre tract with a 75% leasehold interest produces 240 net leasehold acres; a neighbouring 160-acre tract with a 25% interest adds only 40 net acres.
Keep separate columns, or separate notes, for net mineral acres, net leasehold acres, net working acres and net royalty acres. If a company owns 100% of a lease but has farmed out 40% of the working interest, its net leasehold and net working positions may differ. If an overriding royalty or other burden applies, the net revenue outcome may be lower again.
Do not calculate a blended net-acre figure until every component uses the same definition. When the ownership percentage is uncertain, show a range and label it clearly. This is preferable to treating an unverified prospect estimate as a precise number, particularly when comparing acquisition targets or estimating drilling inventory.
Compare Acreage With Wells And Development Activity
Acreage becomes more meaningful when viewed alongside drilling activity. Check whether producing, permitted, drilled or abandoned wells intersect the tract, sit nearby or target the same formation. Well locations can indicate operator presence, infrastructure access and evidence of commercial development, though they do not guarantee that an undeveloped parcel has the same value.
The well information can help you examine nearby activity and distinguish an apparently large but isolated position from a smaller tract within an active development area. Review well dates, status, operators and formation information where available. A tract surrounded by recent permits may warrant a different diligence path from one with only old vertical wells or no nearby activity.
The comparison is especially useful in shale plays where horizontal laterals may cross multiple parcels or pooled units. Gross acreage alone may exaggerate drilling potential if the tract is too narrow, divided among owners or outside current spacing patterns. Conversely, a modest net-acre position can be strategically valuable if it sits within an established development corridor.
Turn The Map Comparison Into A Decision Record
Create a tract worksheet that records the mapped boundary, gross acres, ownership percentage, calculated net acres, rights type, source date and confidence level. Add notes about adjacent leases, permits, wells, roads, pipelines and any apparent gaps in title or data. This produces an audit trail that can be reviewed by an engineer, landman, attorney or investment committee.
Rank the position using consistent measures such as net acres in the target formation, proximity to active wells, lease term, operator control and infrastructure access. Keep commercial assumptions separate from map observations. For example, the map may show 1,280 gross acres and 640 net acres, but it cannot by itself establish recoverable reserves, lease validity, royalty terms or development economics.
For teams in Sydney, Brisbane or Melbourne assessing a US opportunity, also document currency assumptions and the distinction between acres and hectares in internal reports. A clear record prevents acreage figures from being repeated without context as the opportunity moves between technical, legal and investment reviews.
Use the map to create a defensible first comparison, then verify the strongest candidates against title records, lease documents, regulatory filings and professional land or legal advice. Start with a free seven-day account on Shale Navigator, trace the tract, compare its gross footprint with its likely net interest, and save the evidence needed for the next stage of due diligence.