


Estimating a shale lease bonus from nearby transactions
A nearby shale transaction can provide a useful starting point for estimating what a mineral owner might receive for leasing oil and gas rights. It is not a guaranteed price, because every deal reflects its own geology, lease terms, operator strategy, timing and competition. Still, nearby evidence is often more practical than relying on a broad regional average.
For Australian readers, the comparison is easiest to understand through familiar local examples. A landholder in the Surat Basin or Bowen Basin may assess a proposed payment by looking at nearby agreements, current drilling activity and the value of future gas development. In the United States, the same reasoning applies to shale plays, although private lease bonuses and royalty structures are usually documented differently from Australian land access arrangements.
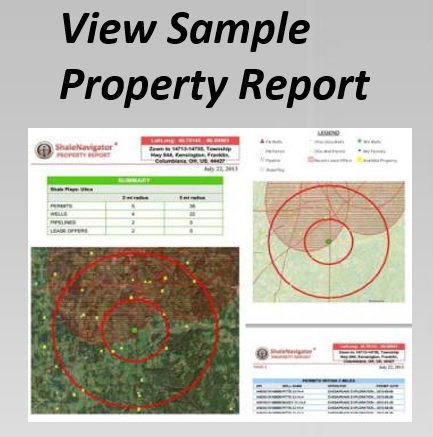
Shale Navigator’s map can help bring these pieces together. Layers for permits, leases, wells, pipelines, mineral rights and property boundaries allow you to move from a general market impression to a location-specific estimate. The goal is to identify genuinely comparable transactions, adjust their terms and record the assumptions behind your calculation.
The result should be treated as a defensible negotiating range rather than a precise valuation. A clear method is especially valuable when several owners, an investor group or an engineering team needs to understand why one estimate is higher or lower than another.
Start with the right neighbouring transactions
The most useful comparison is usually close in distance and similar in development context. Look for transactions within the same shale play, preferably within the same county or a nearby producing trend. A lease signed beside an active horizontal drilling programme may carry a very different value from one several kilometres away across a geological boundary.
Distance alone is not enough. Check whether the neighbouring parcel has a similar acreage position, access to roads, pipeline takeaway and likely well spacing. A tract near a gathering line or compressor station may be more attractive to an operator than an isolated property, even if both parcels sit over the same formation.
In Australian terms, this resembles comparing a grazing property near established gas infrastructure with a remote block that still needs access approvals and field development. The map should help you identify that difference before using a transaction as a benchmark.
Define the market area on the map
Begin by selecting the relevant shale play and viewing surrounding permits, wells, leases and pipeline corridors. Use property boundaries to establish a practical comparison area, such as a five- to ten-kilometre radius, then expand it only if too few transactions are visible. Keeping the first search tight reduces the risk of blending unlike markets.
Record the transaction date, acreage, operator, formation and apparent lease status. Market conditions can change quickly when commodity prices rise, a major operator enters the play or permitting accelerates. A lease signed during a competitive land rush may not be a fair guide to a quiet period several years later.
You can also use the platform’s guidance on spotting undeveloped mineral rights to distinguish an apparently vacant tract from one with a more complex ownership or development history. That distinction matters when a “nearby” parcel has not actually been available to the same bidders.
Compare the economic terms, not just the headline payment
The lease bonus is the upfront payment, often expressed as dollars per net mineral acre. Convert each comparable transaction to that common measure:
Bonus per net acre = total upfront bonus ÷ net mineral acres leased
For example, a reported payment of US$900,000 for 600 net mineral acres implies US$1,500 per net acre. If your target property contains 420 net mineral acres, applying that unadjusted figure would produce an initial indication of US$630,000.
That calculation is only useful when the acreage figures are comparable. Gross acres can include land where the lessor owns only part of the minerals. Confirm whether the source refers to gross surface acreage, net mineral acreage or a pooled unit. Check the primary term, extension options, royalty rate, depth restrictions, development clauses and any bonus instalments.
Royalty is especially important. A lower bonus may be acceptable where the lease offers a stronger royalty, better post-production cost protection or more favourable development obligations. Treat the upfront amount and the long-term revenue terms as connected parts of the same negotiation.
Adjust for geology and development readiness
A neighbouring lease can command a premium if it lies in a proven sweet spot with productive wells, strong pressure data and predictable completion results. Look at nearby permits and producing wells for signs of operator interest. Repeated permitting activity can indicate that the area is moving from speculative acreage to active development.
Infrastructure can also change the estimate. A tract connected to gathering systems, processing facilities and reliable roads may be easier to develop than one requiring new construction. Pipeline layers help reveal whether gas can reach market efficiently, while property and access information may expose fragmented ownership or difficult surface arrangements.
For an Australian comparison, think about the difference between established Surat Basin infrastructure and a remote area where roads, water management and pipeline connections still need significant investment. Local land access expectations, environmental approvals and community agreements can also affect timing, even when the underlying resource is attractive.
Build a simple range from the evidence
Rather than selecting one transaction and treating it as truth, group the best comparables into low, middle and high cases. Remove transactions with unusual circumstances, such as distressed sales, family arrangements, broad corporate packages or acreage bundled with unrelated assets.
A practical worksheet could contain:
- Transaction date and location
- Net mineral acres and bonus per acre
- Primary term and extension period
- Royalty and other economic terms
- Nearby wells, permits and pipeline access
Calculate the median bonus per net acre from the most comparable records. Then apply adjustments for geology, infrastructure, operator competition, acreage size and lease quality. For instance, a target with strong pipeline access and recent permit activity might receive a 15 per cent premium, while a smaller, fragmented tract could receive a discount.
Keep the adjustments explicit. An estimate of US$1,200 per net acre with a 10 per cent infrastructure premium is easier to review than a rounded figure that cannot be traced back to evidence. If the negotiation will occur in Australia, show the equivalent Australian-dollar figure separately and identify the exchange rate date, rather than mixing currencies within the underlying comparison.
Watch for data gaps and misleading signals
Map data can reveal patterns, but it may not display every private agreement or the full wording of a recorded instrument. A transaction marker could reflect an assignment, a lease acquisition, a memorandum or a larger package rather than a fresh arm’s-length lease. Treat the record as a lead for verification.
Also check whether the transaction covers all depths or only a named formation. A lease limited to one zone may have a lower value than a broad rights package. Similarly, a deal involving a small working interest or a partial mineral interest should not be compared directly with a full mineral-rights lease.
Common warning signs include:
- A reported acreage figure that conflicts with parcel ownership
- A transaction far outside the target formation
- An old deal from a different commodity-price cycle
- A bonus that includes non-cash consideration
- A lease with unusual royalty, pooling or depth provisions
When uncertainty is high, widen the range and label the estimate as preliminary. A cautious range is more useful for negotiations than false precision based on incomplete records.
Turn the estimate into a negotiation brief
Once the comparable set is established, prepare a short brief showing the map location, selected transactions and adjustment logic. Include screenshots or saved map views where permitted, along with notes on wells, permits, pipelines and ownership. This gives a landowner, landman, attorney or investment committee a shared factual basis.
Subscription access may be useful when the initial map review needs deeper data, additional layers or reporting tools; details are available through subscription options. The value lies in connecting the payment estimate to the surrounding development picture, rather than presenting a bonus number without context.
For a property owner, the brief can support a request for competing bids and help identify terms worth negotiating beyond the upfront payment. For a mineral-rights investor, it can support acquisition screening. For an attorney or land professional, it creates a documented starting point before reviewing title, lease language and local legal requirements.
Apply a repeatable review process
A reliable estimate should be updated when new permits, wells, infrastructure projects or transactions appear. Shale development can change quickly, and a figure that was reasonable six months ago may need revision after a major operator expands its position.
Before relying on the estimate, verify title and lease records through appropriate professional channels. A map is a powerful screening and analysis tool, but it does not replace legal review, a title opinion, an engineering assessment or advice on tax and currency treatment. Australian users should also separate this US shale analysis from the rules governing Australian petroleum tenure and land access.
Use the map to establish evidence, calculate a transparent range and identify the questions that require document-level verification. For help interpreting a particular map result or data issue, the support team can provide a practical point of contact.
Open the relevant shale play in Shale Navigator, locate the target parcel, and record the strongest nearby transactions before assigning a value. With comparable acreage, lease terms, development signals and clearly stated adjustments, your estimate can become a credible foundation for the next negotiation.